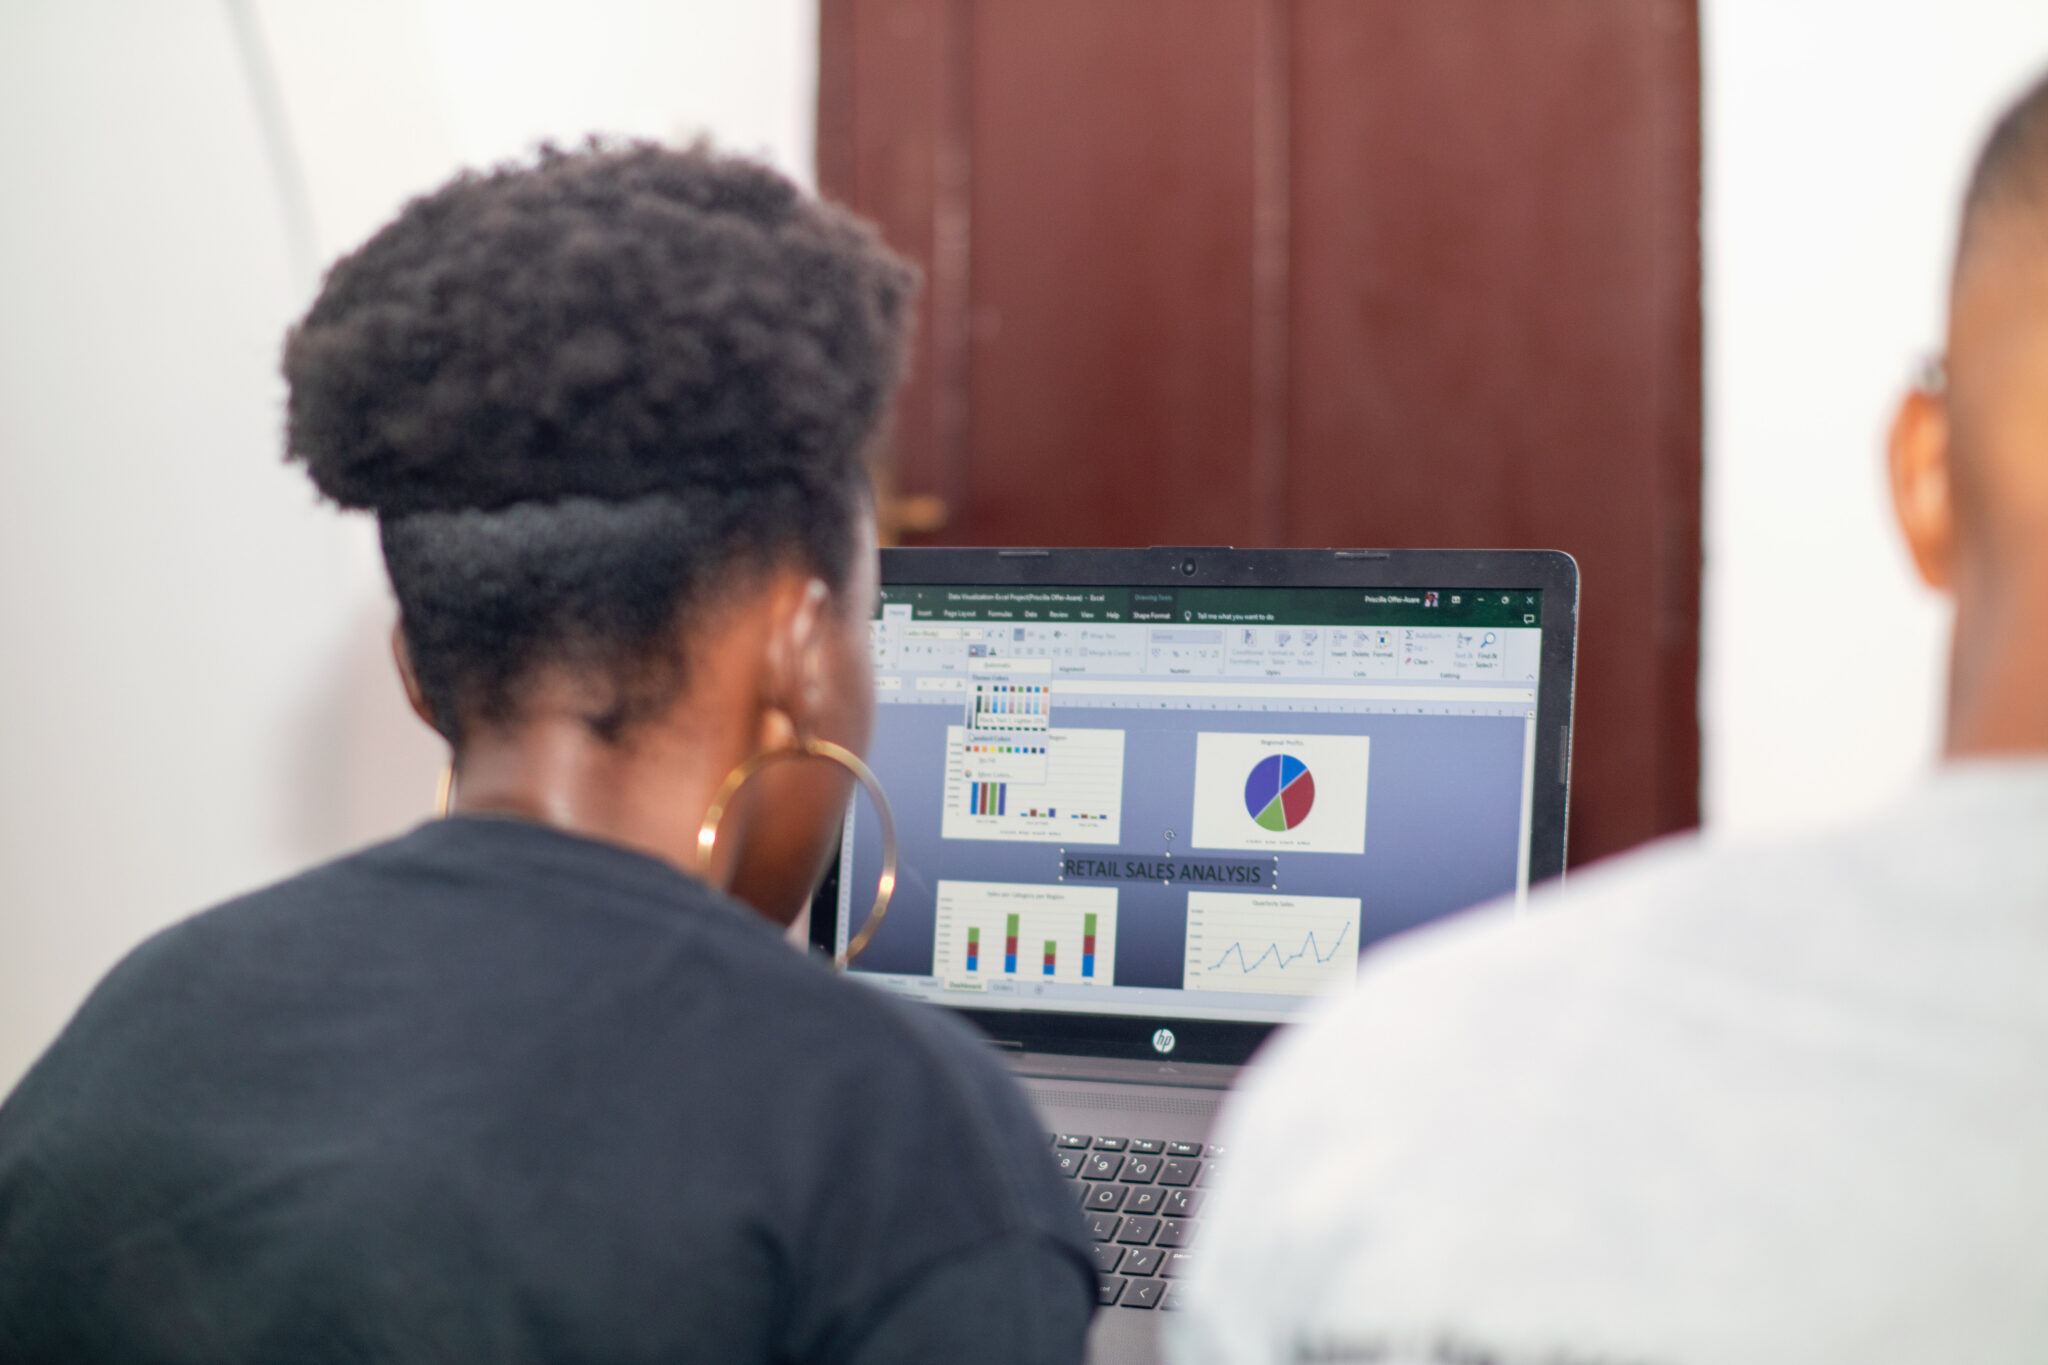
Learn how to build predictive models using Python programming that drive decision-making and effective strategy in an organisation.
Learn how to build predictive models using Python programming that drive decision-making and effective strategy in an organization.


Our global partners enable us to offer world-class data and leadership programs to Fellows from underserved communities, all at no tuition cost.
Job opportunities you can apply for at the end of the training includes:

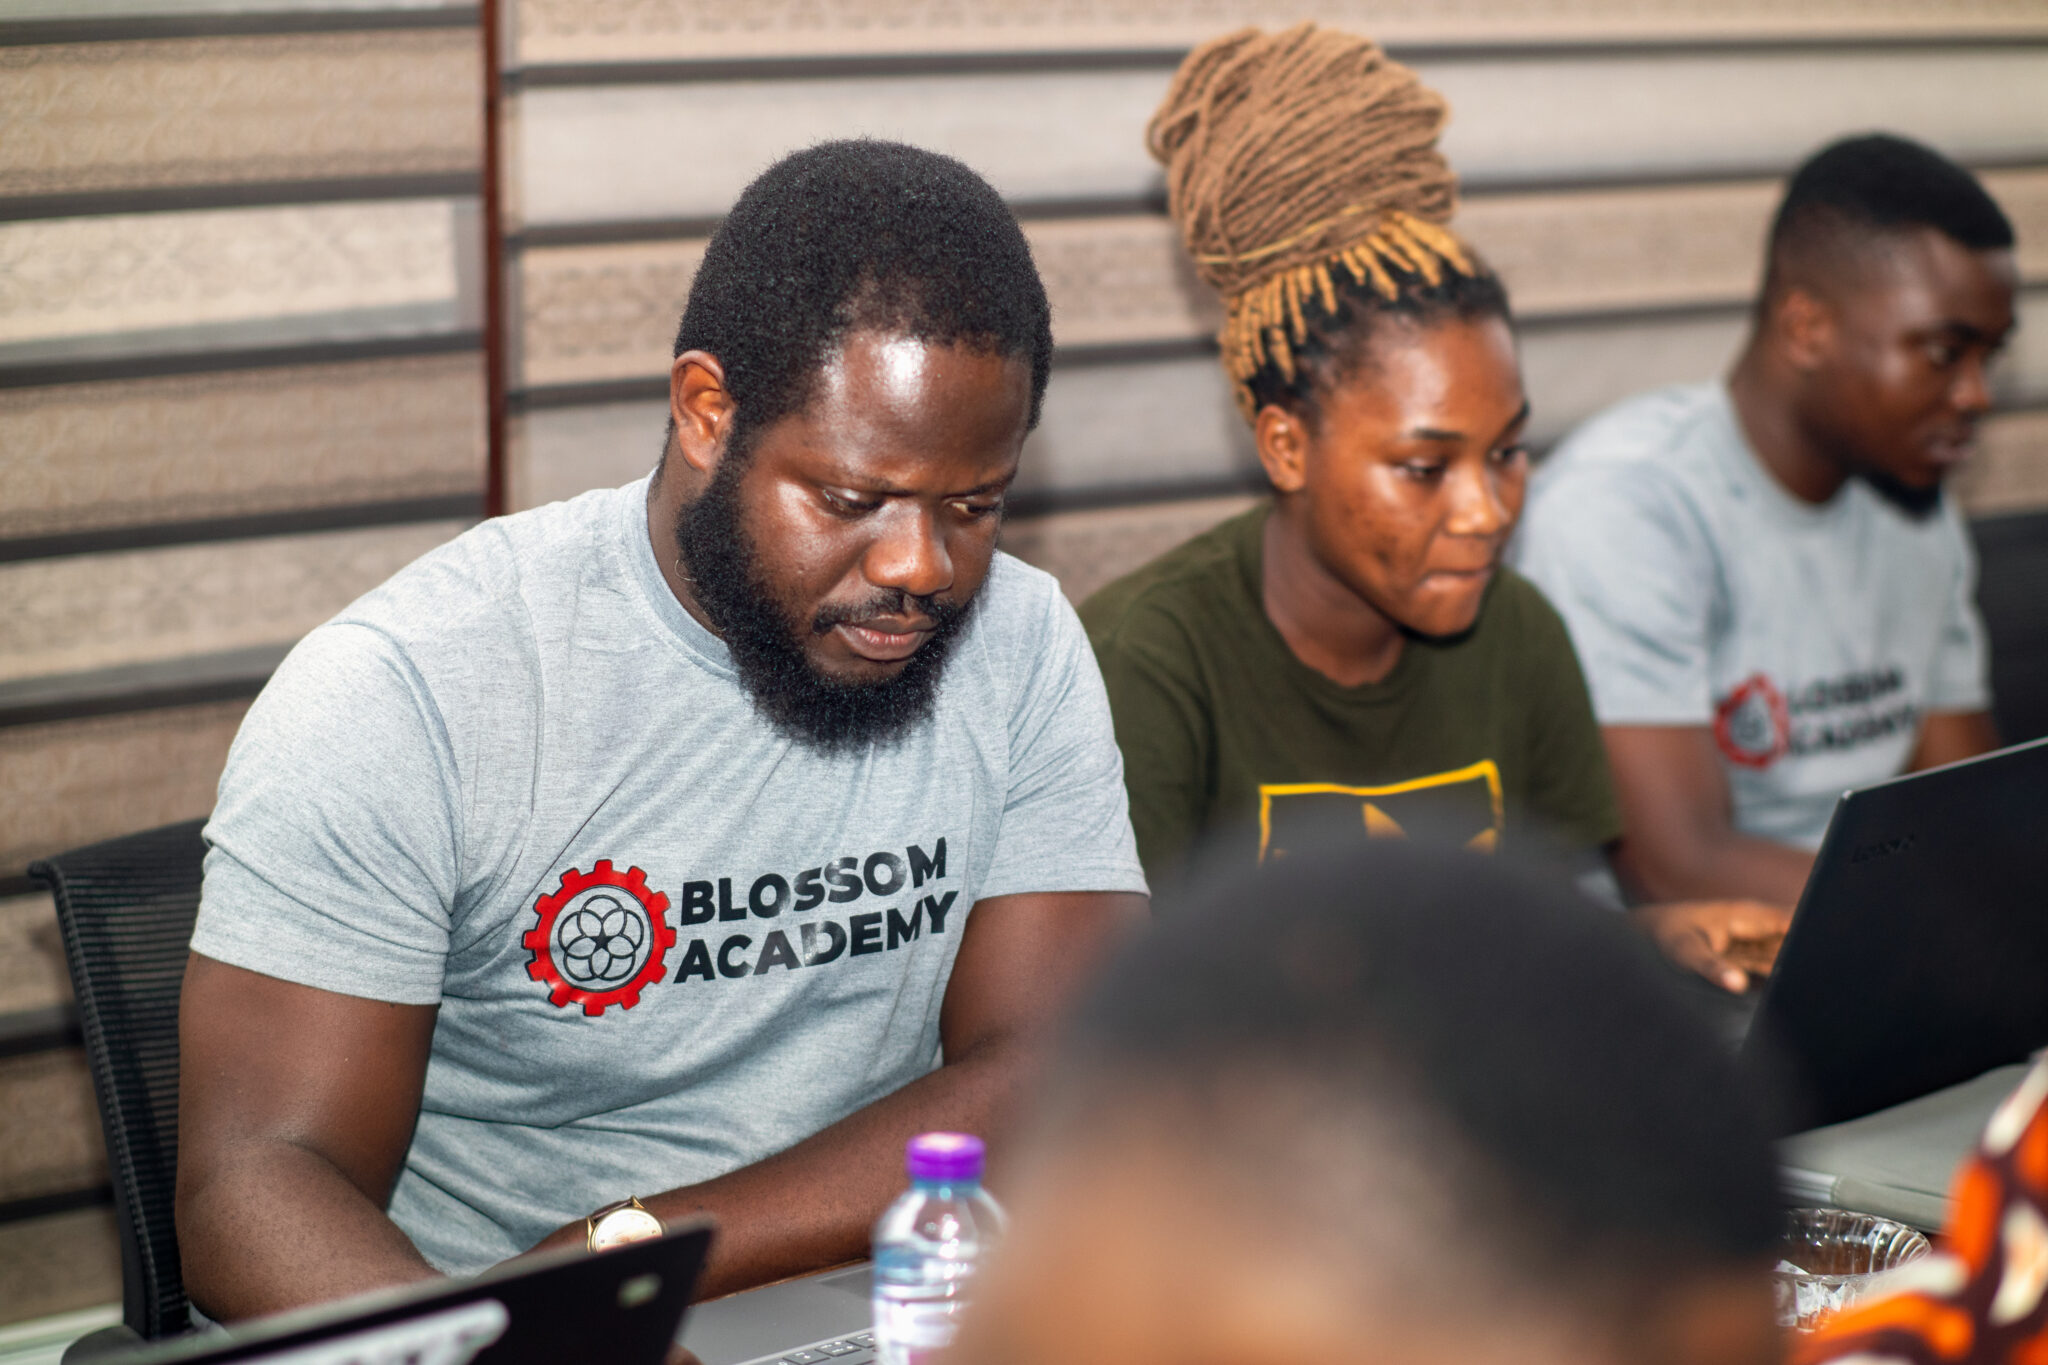
You will be placed in small groups to work together as a team and complete academic goals in real-time virtual classrooms and during in-person sessions; which has goals at the individual and group level.
A mentor will be available at all times during office hours to provide help and evaluate your work. We offer you a supportive and engaging work environment, where you can feel free to make mistakes and learn.
Our learning methodology focuses 100% on the needs of today’s market. You will work on real-world projects similar to those you’ll find on the job and complete them using the same tools used by professionals.
Submit your application. Share a bit about yourself and what's driving you to start a career in data science.
Complete a short critical thinking and problem-solving assessment. This allows us to assess your aptitude for data.
Speak with an Admissions representative in a non-technical interview. This is an opportunity for us to get to know each other a little better. Nothing technical - just a friendly conversation.
Receive your acceptance decision from Admissions. This usually happens within 3 business days.
If accepted, you'll begin course pre-work to prepare for the first day of class. Our data courses pre-work consists of 20-40 hours of lessons and labs covering the basics of Python (including loops and functions), statistical measures such as central tendency and dispersion, and building data visualizations using matplotlib and seaborn
Our “Why” is to democratize economic opportunities for underserved communities through education and technology.
Subscribe to our newsletter to get updates on our upcoming programs!
Copyright © 2024 Blossom Academy
Subscribe to our Newsletter to get updates on our latest offers!
Quisque velit nisi, pretium ut lacinia in, elementum id enim.